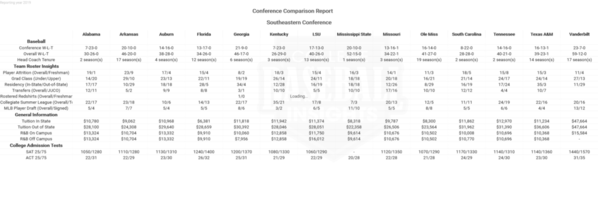
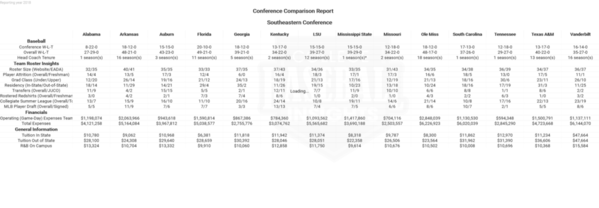
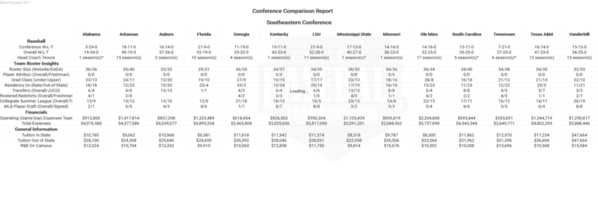
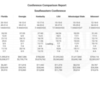
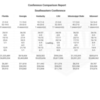
Conference Comparison Report quickly allows interested party to review some Key Performance Indicators for all teams within a conference.
Most KPI's are self-explanatory.
Baseball
- Conference W-L-T
- Overall W-L-T
- Head Coach Tenure
- Number of years coaching , "*" means pending coaching change.
Team Roster Insights
- Roster Size (Website/EADA)
- Compares the roster on the team website with the participation size reported to Dept of Education. Why is this relevant, the team website for specified year might not accurately reflect player roster due to attrition, injuries, etc. (e.g. final 2016 Coastal Carolina website roster size equals 29, whereas they reported 35 to Dept. of Education).
- Player Attrition (Overall/Freshman)
- Compares two consecutive years, (e.g. 2019 report compares 2018 and 2019 rosters). Overall number of players from 2018 team that are not on 2019 roster
- Grad Class (Under/Upper)
- Number of Underclass (Freshman, Sophomore) vs Upperclass (Junior, Senior, Graduates)
- Residency (In-State/Out-of-State)
- Number of Students on team for home state vs Out-of-State
- Transfers (Overall/JUCO)
- Number of players that have transferred into program (Overall number of players vs number of Junior College Players)
- Rostered Redshirts (Overall/Freshman)
- Number of players on the roster that have been redshirted. Note, there is a time lag with respects to teams identifying players on roster as being redshirted. Also not all teams included their redshirts on the rosters. This can lead to misrepresentation of Player Attrition
- Collegiate Summer League (Overall/Top 10)
- We collect summer league roster for more than 30 collegiate summer leagues. This insight can be used to determine which coaches have success with summer league placement. Overall number of players that a team sent to summer league vs Number of players that played in a top 10 summer league
- Top 10 leagues in 2019 (https://www.summerbaseballregi...com/2019_ten_leagues)
- We collect summer league roster for more than 30 collegiate summer leagues. This insight can be used to determine which coaches have success with summer league placement. Overall number of players that a team sent to summer league vs Number of players that played in a top 10 summer league
- MLB Player Draft (Overall/Signed)
- Number of Players Drafted and signed for the specified year. Why relevant? Helps understand player attrition due to draft
Financials
- Operating (Game-Day) Expenses Team
- All expenses an institution incurs attributable to home, away, and neutral-site intercollegiate athletic contests (commonly known as game-day expenses), for (A) Lodging, meals, transportation, uniforms, and equipment for coaches, team members, support staff (including, but not limited to team managers and trainers), and others; and (B) Officials.
- Total Expenses
- All expenses attributable to intercollegiate athletic activities. This includes appearance guarantees and options, athletically related student aid, contract services, equipment, fundraising activities, operating expenses, promotional activities, recruiting expenses, salaries and benefits, supplies, travel, and any other expenses attributable to intercollegiate athletic activities.
General Information
- Tuition In State
- Tuition Out of State
- R&B On Campus
- R&B Off Campus
College Admission Tests
- SAT 25/75
- ACT 25/75
2019 Season
2018 Season
2017 Season

