From http://baseballnews.com/transf...t-sport-of-baseball/

“The current transfer rule that NCAA Division I baseball utilizes was adopted for the 2007-2008 academic year. Prior to that, players could transfer and play immediately at other Division I schools.

“I remember when this change was being adopted that 27 percent of Division I baseball players transferred the year before. That is a quarter of rosters transferring to other schools."

And, from https://247sports.com/college/...ably-hard-166669893/

~~From 2004-19, the number of transfers went from 27.7 percent to 24.2 and peaked at 27.8 in 2006 and dropped as low as 21.1 percent in 2016. ~~

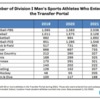
Original Post

Replies sorted oldest to newest

I love college coaches, some day i want to live in that world.

You recruit 10 20 new players every season for a roster of 35 on a team that actually plays 20. you treat them a step or 2 above dogs or however you see fit, you demand year round 100% commitment to the team with limited to none back from the program for 25% ride (or less, mostly less)...then you bitch about kids transferring if they aren't happy but you as coach have the right, the expectation and support from school to do whatever the hell you want with the roster just win baby....delusional comes to mind.

Hey coach I got an idea for you, you can make much better money if you are as good as many think you are. Come to the business world and see how your management methods treat you.

Last edited by old_school
@fenwaysouth posted:

Sorry, I'm not buying ~25%.  Can't do it.   My ears and eyes told me 33-50% 10-years ago.  I believe the number is even higher now with the transfer portal and no requirement to sit out a year.

It does seem low when you figure that 25% might just be the overall number of kids who transfer out in a year not factoring in if they were baseball players or not.

"From 2004-19, the number of transfers went from 27.7 percent to 24.2 and peaked at 27.8 in 2006 and dropped as low as 21.1 percent in 2016. Transfers from one four-year school to another went from 8.1 percent to 2.3 while transfers from a two-year school to a four-year school rose from 19.6 to 21.8."

Unfortunately, there is no citation and no definition to support this statement.

Does the 21.1% include all transfers to and from D1? It's likely to include juco to D1, which is an entirely different animal than the others. There's nothing "wrong" with a kid starting at juco then transferring to D1. That is, it's not a sign of a problem. Conversely, D1 to juco to D1 is not ideal for anyone. And D1 to D2/D3 isn't great either. I know many kids survive and prosper taking those non-traditional routes, but most people would rather not have to deal with the disruption.

The recent rule change will mean more D1 to D1 transfers, but less D1 to juco transfers. I don't think it will change the overall transfer numbers much. Depending on how you measure it, the rule change could reduce overall transfers because many 4-2-4 kids will change to 4-4 (one less transfer).

I looked at son's freshman class, 2019,  to now three years later.  Son's class is 33% gone from 2020 roster to today.  All 4/12 were pitchers.  2020 class 5/16 so 31% with all but 1 being a pitcher.  2018 class was 25% with all being pitchers.  Couldn't tell before that and would be affected by new staff coming in.  I think it will be about 35-40% now with one time transfer.

I would be interested to know if the numbers are consistent at other schools with more pitchers leaving than position guys.  I think if you are not getting any pitching time after your sophomore year you probably are not going to get mound time at any given school.  I also think that coaches take more chances on pitchers than they do position players.

I also noticed something that I should have caught but I reckon I just missed it in the transfers.  Of the 4 my sons year 3 were local kids.  My son who coaches juco has to take so many local kids each year.  Of the 5 the previous year, 4 were local/in state kids.  All the year before were in state kids.  These are the ones that I think coaches are pressured to take because they have success in high school and it doesn't cost them anything.  Willing to bet none of them were on scholarship.

I looked at several in state P5 schools and they were not much different.  The majority of kids leaving were pitchers, except this year at USC, and were in state players.

@fenwaysouth posted:

Sorry, I'm not buying ~25%.  Can't do it.   My ears and eyes told me 33-50% 10-years ago.  I believe the number is even higher now with the transfer portal and no requirement to sit out a year.

It’s been a few years. My son is twenty-eight now. About ten years ago I read about 50% of D1 players transfer by the end of soph year. The number may be from before the “sit out” rule. It wasn’t it in place when my daughter played softball. The data may be from those years. She’s five years older.

Last edited by RJM

Here is a link to CBI Team Roster Turnover Insights

Note, just to provide context all information is based on spring rosters (point in time)

Players that are were never on their previous schools spring roster but are list on the new schools roster may or may not be accounted for.

This is most notable with fall dropdowns to jucos, as for the player never officially made the varsity team.

Note, JUCOs are notorious in not documenting the player's previous school, we've tried to fill in this blanks were possible.

Data from PG, PBR Fieldlevel, NCSA on commits would probably fill some of the HS Fall semester transfer holes, but the disclaimer, for example PG is that commit data is not 100%

Outgoing moves are based on

2021 Season (compared against 2020, all divisions reconciled)

2020 Season (compared against 2019, D1 90% reconciled, other division ~ 75%)

2019 Season (compared against 2018,  probably 60%)


So you can use the tool to get a baseline number by year and then add a percentage above for the fall transfers


Note, we uploaded the 2021 Fall Roster (as 2022), so you can get a baseline of potential turnover.

Note, this is raw data, so the numbers are skewed. Secondly, not all schools published the fall rosters.

I've heard a lot of numbers thrown around. I'm curious about how they work

Are those NCAA to NCAA transfers or do they include NJCAA and NAIA?

What would the numbers look like if you included kids who remained at their school but chose not to pursuit baseball any longer?

In talking with people - it seems the number is in the 40% range. It would also probably be in the 60-70% if you go by kids who start at a program and transfer out or do not use all their eligibility.

This is part of the reason it would appear I'm in a dark place regarding college baseball.

Add Reply

Post
.
×
×
×
×
Link copied to your clipboard.
×