PG is only tracking about 500 or so high school ballplayers (2016 thru 2019) that have touched 90 or above...considering the amount they see and the amount of HS pitchers there are, this is not a large amount out of the United States...I'm sure they haven't seen them all, but chances are if you have touched 90, you are probably being told (or recommended) to attend an event.
What about d3, naia, nccaa notice the second C in that one National Christian College Athletics Assoc. Alot of these teams have two college squads so im thinking there is oppertunity there with solid secondary pitches.
Originally Posted by Blake Martin:
What about d3, naia, nccaa notice the second C in that one National Christian College Athletics Assoc. Alot of these teams have two college squads so im thinking there is oppertunity there with solid secondary pitches.
I think a lot of that will be dependent on the area. At least from what I am seeing, the smaller schools aren't drawing players from a large geographical area - so their staff is going to be dependent on what is available locally.
We don't have D3's in Florida, but there are a few NAIA schools and a bunch of JCs. One of the NAIA schools that has an interest in my son has a staff of guys who are in the mid 80's for the most part. Pretty much the entire roster is made up of local guys.
The local JCs and Div2 schools all seem to be staffed with guys in the mid to high 80's.
I attend a bunch of University of Miami games every year. They will usually trot out a few guys who sit low 90's, but many that are 86-89 guys. There also always seems to be a sidearm guy or two who are in the low 80's.
Assuming only 5 pitchers on a HSV team, with roughly 13,000 schools playing baseball, that’s 65,000 varsity pitchers. Even if the percentage of pitchers hitting 90 were as high as 10% it would still only be 6,500 who could do it.
Originally Posted by phillyinNJ:
PG is only tracking about 500 or so high school ballplayers (2016 thru 2019) that have touched 90 or above...considering the amount they see and the amount of HS pitchers there are, this is not a large amount out of the United States...I'm sure they haven't seen them all, but chances are if you have touched 90, you are probably being told (or recommended) to attend an event.
Rough math - over 10,000 HS in America. Each school probably has at least 10 JV and V pitchers so that is 100,000+ kids and 500 at 90. The is 1/2 of 1%.
Watched several hundred HS games and 90% were <=83 MPH. There were about 10% between 83 -88. Saw 3 legitimate 90's. Showcases were a different story but the actual HS games typically was a duel of one kid at 77-81 vs. another at 80-83.
2020dad
Originally Posted by Leftside:
Originally Posted by 2020dad:
Originally Posted by SluggerDad:
Originally Posted by 2020dad:
According to the PG site the average high school senior at their events is 80mph and thats a top velo number. And thats at PG events! Imagine if we had all hs velocities.
But the average high school senior at PG event is not an average D! player. So I don't see your point.
So the point is you would expect the PG guys to be faster and even there 80 is average. Just looked at a ranking and found the 250th ranked D1 team. Looked up their pitchers (yes I have no life). Latest PG or PBR velocity... 1 at 90, 89 and 88. 2 at 87 and 86. One each at 85, 84, 83, 82, and 81. And these are top velos not cruising speeds. Now I am sure some of them have improved. But still I stick to saying that cruising 83-85 and topping 86 can get you on a D1 roster. Also there were 5 pitchers I could not find velo for. At least presumably those would be on the low end.
I went to a Fresno St./Univ of Nevada game last year and saw the RHP starting for Nevada, ranked in the top 35 at that point, sitting about 85. Many FBs in the 83-85 range. He was effective, pounded the zone and had a couple of other pitches. Of the six pitchers I saw that day two were sitting in the 84ish range. Two more were in the 86 range from the right size and two were sitting high 80s (88-89) and touching 90 or 91 on occasion. Those are both solid D1 programs. This was a midweek game and both have guys that are 90+ I am sure, but, four of the six guys I saw were sitting in that 84-86 range, mostly from the right side, getting innings in a conference D1 game.
Thank you Leftside, I like you more and more each day!
2020dad
Originally Posted by phillyinNJ:
Just received an email from a mid-D1 about an evaluation of 2018 after a college camp and in it he mentions the average D1 pitcher is 85-87.
And obviously if that is average there are those above AND below that number! Thanks for the input. reassures those of us with younger ones that you don't have to become Nolan Ryan to be part of a D1 team.
Originally Posted by 2020dad:
Originally Posted by phillyinNJ:
Just received an email from a mid-D1 about an evaluation of 2018 after a college camp and in it he mentions the average D1 pitcher is 85-87.
And obviously if that is average there are those above AND below that number! Thanks for the input. reassures those of us with younger ones that you don't have to become Nolan Ryan to be part of a D1 team.
Like I said earlier, I'm not an expert and I don't want to rain on anybody's parade. But really if you think sitting mid to lower 80's is going to get a kid much notice from D1 recruiters -- unless the kid has wicked movement and great command to go with the mid eighties stuff -- then you are almost certainly dreaming, I would guess.
Think of it this way, there are roughly 10,000 D1 baseball players in the entire country. Just over 2% of high school baseball players go on to play D1 baseball. So If you aspire to be a D1 pitcher, you should probably aspire to be in the top 2 - 3% of HS pitchers in the entire country.
Question, do you really think a fastball sitting low to mid 80's is going to put you in the top 2-3% of pitchers? I grant that it might -- but only if it is accompanied by wicked movement and absolute command of both it and a at least two secondary pitches. Otherwise, I rather seriously doubt it will get you even a first look, let alone a second look. But again, that's just a guess really.
Or look at it another way, assume 35- 40% of D1 rosters are pitchers. That's about 3.5 - 4K pitchers total at the D1 level at any given time. They are not evenly spread out across the classes, obviously, since lots of juniors get drafted and there is much attrition along the way. But there are also JC transfers and others who don't start out at D1 but move into D1 as non-frosh.
So how many freshman pitchers every year -- assuming it's somewhat more heavily weighted toward frosh -- maybe 1500 or so frosh every year.
Ask yourself how good a kid has to be to have a chance at being one of those 1500 out of the X thousands HS Senior pitchers -- surely x = many 10's of thousands. Possibly as many 70 or 75k if the 2-3% figure for how many go on to play in D1 applies to both position players and pitchers.
Again, ask yourself how good do you have to be and how much do you have to stand out from the crowd, in order to make it into that very elite company? I would say you have to be pretty special in some way -- command, velocity, movement -- at least 2 of the 3 probably.
Originally Posted by SluggerDad:
Think of it this way, there are roughly 10,000 D1 baseball players in the entire country. Just over 2% of high school baseball players go on to play D1 baseball. So If you aspire to be a D1 pitcher, you should probably aspire to be in the top 2 - 3% of HS pitchers in the entire country.
Numbers don't lie; if 2% of HS players make it to D1 ball and 50% are pitchers, that works out to be one pitcher for every 10-15 high schools (assuming 5-10 graduating seniors).
Ask yourself the question, is your kid the best high school player that you will see this season?
My son and his best friend are both freshmen at D1 JUCOs in Texas. They were in the same tournament last Friday so his dad and I spent 13 hours sitting in the stands watching ball. Heck of Bro date as our wives called it.
Anyhow, since his son is a pitcher we always sit straight behind home plate when we can. Soon we were surrounded by scouts.
My son played the first game of the day. His son played the last and they played each other in the middle.
I counted over 30 scouts from D2s, Conference USA, Southland, Big 12, and the Pros.
Most teams went one inning per pitcher so we got to see just about every pitcher on every team that day.
Since we were surrounded by scouts we were surrounded by radar guns.
Observations:
#1. We saw less than 5 pitchers hit 90. We saw only two that all pitches were 90 or above.
#2. Most pitchers were between 85 - 89.
#3. Any pitcher under 85 was either lefty or had an unusual delivery
#4. Scouts would gun your first few pitches and if you didn't sit 88 or above they were not interested. You better come in warmed and throwing your best.
#5 The goose with the golden egg was a 6'5" lefty whose first pitch was 92 and he sat 90-91 for his inning. Every scout within eye contact was up on the edge of his seat and gunned every pitch. They were taking copious notes as well.
Other observations not related to pitching velo:
Scouts are a small group of buddies. They all know each other and they trade notes on players like two kids with a bunch baseball cards. We sat and listened to a D2 Texas based scout talk with a D1 scout from the east coast and one asked the other if he'd seen any decent outfielders. The other asked what are you looking for? He described the skills they were looking for and the other scout directed him to a JUCO coach that had a guy that might fit for him. He knew the coach he was referring and didn't need his number. Absolutely fascinating conversation to observe. Several other conversations were similar.
They were mainly interested in the sophomores. Makes sense but our boys are freshmen so it was interesting to see the difference in their interest between the two. As the day waned on the scouts thinned out and by the time his son was scheduled to pitch we hear the two closest scouts say the next guy is a freshman. Let's go eat. and They left. Several times someone would do something and one would ask another if he was a soph or fish and if fish they were not as interested.
Very interesting to watch those guys work. In a baseball geek sort of way. I had two in front of me close enough I could see them writing. It was cool to see how different their methods were. One basically kept score in each game and made notes out beside a player of note. He would then turn over his score sheet and make additional notes about throwing slot or swing plane. The other drew a diamond on a blank sheet of paper and made notes at each position with player's numbers from the rosters they were given. A third basically filmed players he was interested in.
...and yes, I do know that college coaches are recruiters not scouts. It's just easier to lump them all together under one term.
Originally Posted by ILVBB:
Originally Posted by SluggerDad:
Think of it this way, there are roughly 10,000 D1 baseball players in the entire country. Just over 2% of high school baseball players go on to play D1 baseball. So If you aspire to be a D1 pitcher, you should probably aspire to be in the top 2 - 3% of HS pitchers in the entire country.
Numbers don't lie; if 2% of HS players make it to D1 ball and 50% are pitchers, that works out to be one pitcher for every 10-15 high schools (assuming 5-10 graduating seniors).
Ask yourself the question, is your kid the best high school player that you will see this season?
That's good math. I try to keep an eye on the more talented kids in my area, which includes about 50 high schools. If you had asked me how many usually go on to pitch at a DI, I would have said about 3 or 4 every year.
I think a lot of those DI pitchers we see throwing 85-87 can and have thrown 90 at one point. They throw 87 tops because they are more effective at that speed, more movement, better command.
There can be a big difference between what a pitcher is capable of and what he might be pitching at iN any given outing. So if we look at the over all perspective of a recruiter or scout, do we want the HS pitcher that tops out at 85 (capable of throwing 85) or the HS pitcher "capable" of throwing 90 or better? Let's face it, nobody averages their peak velocity. But in most cases the higher the velocity the more there is to work with.
That said, there are a lot of outstanding low to mid 80s pitchers. However there are so many low to mid 80s pitchers out there. Scouts and college coaches want to see the pitchers throwing 90 or better as much as possible. So where do they find the time to follow all those low to mid 80 kids enough to figure out which ones are the best? Usually when you see those types in college they come from areas close to the college. Easier to follow and see a lot. You aren't going to often see a good DI program recruiting a low to mid 80s pitcher from a different area of the country.
The other thing to consider is the money/offer. Does anyone really think DIs are offering the kid that throws low to mid 80s much compared to the 90 mph guys? It takes a lot of pitching to get through a college season. If it were possible, the DIs would have nearly all recruits that are capable of throwing 90 or better, even if they end up pitching 85-87.
It really is sort of simple. The 90+ guy can actually have better stuff and success throwing at a lesser velocity. The low 80s guy won't be more effective subtracting 5 mph. In fact, his goal would be to gain velocity. It is much easier to subtract velocity than it is to add velocity. Recruiters and scouts will almost always choose the better arm and think he has the highest ceiling.
BTW, I should get those numbers from our IT department soon.
2020dad
I am afraid I can't let go of this so easily. I am a long time pitching coach and an avid researcher. Velocity is near and dear to my heart. First my figures were more mid 80's not low 80's. And yes every mph matters. 86 is far different than say 84. Whenever we start looking at what percentage make it to whatever the next level is we need to consider a few things. First as hard as it is for us on here to believe some just plain don't want to do it. If they are not going to be a major factor in a team they would rather just walk away. Then there are the couple hundred hs pitchers that get drafted. Then there is the guy topping at 87 who can take a 1/2 scholarship or play football for a full ride. Then there is the kid who wants to go juco because he thinks he will get drafted the following year. Or the kid who plays juco just because he doesn't have the grades. Or the kid whose entire family has traditionally gone to a given high academic D3 and he takes his 87 or 88mph there. Or how about like a guy from my high school who loved sports so much he went D3 even though he was draft material so he could play all three sports. He even told mlb teams not to waste their draft pick because he is not interested. Unfortunately there is illness and injury as well. There are probably dozens of reasons why D1 caliber pitchers don't pitch D1. So lets be ultra conservative and stretch that number out to 2000 rather than 1500. In reality I believe it to be higher. So now you have to be one of the top 2000. Earlier someone said there were 500 or less topping at 90. So 1500 who will join D1 teams are not. It only stands to reason some are mid 80's. 2000 is 40 per state. While california may have 200 (just throwing out a number) wyoming, montana etc may only have a few. My state (wisconsin) is about average for size. Not a particularly great baseball state. I can assure you we do not have 40 seniors throwing even near 90. Another thing about odds, when you are good enough to make one of the best travel teams in your state your odds already increase dramatically. I don't think its fair to throw every single hs pitcher in there. We are only considering those who can throw mid 80's and above. Until someone can give me actual velocities to contradict what I have researched and the anecdotal evidence presented by several who have observed mid 80's D1 pitchers I will continue to remain steadfast that mid 80's can get you D1 somewhere.
FWIW, at son's 1st official Fall Scrimmage this week @ a major D1, 3 of the 4 true freshman hit 90 or more. The 4th was at 88. Bottom of sitting range was 86. Also keep in mind that this is Fall and coaches are NOT encouraging the pitchers to throw as hard as they can.
This one is near and dear to my heart as well as the parent of a 2016 RHP who throws mid 80s (for max) and sits low to mid depending on the day - with excellent location and 2 additional pitches that he throws for strikes (the criteria I saw in some posts above that improves the prospects of a RHP in that velo range). As I've posted in several other treads about velo, there is very little D1 interest out there for RHPs with those characteristics.
Some time spent on PGs website looking at 2016 commits will show you why - they are recruiting RHPs who throw high 80s and sit 84-86. Almost across the board. And I looked at a lot of D1 schools. A look at the 2016 commits from just NY will show you the same thing - they all throw high 80s with a few touching 90. There is one that has a PG max of 84 but he is 6'6" and I'm sure projects as one that can gain velo and another with a PG max of 85 but he's from our HS and he has a verified max of high 80s on another site. That's it.
I know of 3 other 2016 RHPs with similar stats as my 2016. They pitch for a very good travel program here in the NE. The team had 10 D1 2016 commits at the end of this summer season. All the RHPs with max velos in the high 80s from that team have committed (except 1 and he's a PG 9 who throws 90 so I'm not sure what he's waiting for). The 3 with mid 80s max velos, have not signed (not to say they won't or where they are looking).
This is not about my 2016 - he's happily visiting a D3 school tomorrow - it's about the reality of what I'm seeing out there and what the PG stats tell me.
2020dad
Ok we are getting somewhere Now. I feel we are on the verge of a consensus! If it would make everyone feel better I will raise my mph by 1. Say cruising 84-86 topping 87. Now our cruising is clearly mid 80's not low 80's. I agree there is a huge difference between the two. Second I completely agree with PG that the lower level D1 pitchers tend to be local. No school is traveling 5 states away to see a kid throwing 85. Also I want to reiterate I am just talking about being on a D1 team. So lets say the 12th pitcher on the 250th ranked team. In no way shape or form am I suggesting mid 80's guys are heavily recruited. In fact I will go one step further I am not sure they are recruited at all. If you are sitting mid 80's I would think you have to do the lions share of the work. Getting yourself in front of college coaches and selling yourself as a quality individual who will be happy with your role make your grades and be a good teammate. Basically you need to sell yourself because they will not 'recruit' you. Also keep in mind these kids will not be early commits either. They are the last kids to sign when schools realize they are not getting some recruits and now just have to round out their staff. Then you go there and work as hard as you can to work your way up the ladder. Can we agree?
I'm no expert in this area, but at 2019Son's high school, the two 2016 RHP who got the most innings last year have both committed to D1 schools (though not Power 5 conferences). Per their PG profiles:
- One touched 87 last spring (and sat 84 - 85) and has committed to an Ivy.
- The other touched 85 over the summer (sat 81 - 82 when I saw him in the spring) and has committed to one of the service academies.
It may be true that the Power 5 conferences generally don't recruit RHP with those measurables. But, to 2020dad's point about the 250th ranked baseball program, there are 300 D1 schools.
All that said, we know a couple of 2019s (one LHP and one RHP) that have hit 85 already (per PG profile or other independent source) and, man, do they get a lot of recruiting interest.
OK, I now have the numbers I promised earlier.
A couple things to keep in mind...
The velocity we have recorded doesn't mean that is actually the highest velocity any of those pitchers has thrown. Also we tend to see a much higher percentage of all those that throw higher velocities than we do all those that throw lower velocity. And also we see a larger number of pitchers than most anybody, we still only see a small percentage of all the HS pitchers out there. Also, remember that our database grows almost daily.
According to our database as of this morning. HS age pitchers only.
Peak Velocity 90 mph or better
Total - 876
2015 class - 489
2016 class - 324
2017 class - 47
2018 class - 16
Peak Velocity 88 mph or better
Total All Classes - 2116
Peak Velocity 85 mph or better
Total All Classes - 6,429
Peak Velocity 80 mph or better
Total All Classes - 26,617
I will let our math minds take over from here. But keep in mind these numbers are only a fraction of the total amount of HS age pitchers. Also, this does not include all those under 80mph.
I think I can agree to that - as I watched several games of the college world series this year and saw guys throwing low to mid-80s from some schools so I know they are out there. I'm really talking about the reality of being recruited as a RHP. I think the numbers you have there of sitting 84-86 and topping at 87 and above sounds right (with some exceptions here and there as I noted just in NY).
For point of reference - most of the schools I looked at were northeast D1 programs. I did not look at mid-west or out west. The schools I look at down south always have guys throwing 88, 89, 90mph.
Another quick story - 2015 RHP from our HS who was also on same summer travel team last summer. Sat mid-80s, high 80s max. Hit 88 early in the summer, lots of interest from northeast schools most of the summer. He went to a school down south with another team just to pitch in front of that school's coaches. For whatever reason he only hit 86 that day. School said you did great but we need to see you hit 88. They (player and summer coach) said he had hit 88 earlier in the year - not good enough, HC wants to see it, we'll come to your next tournament. Next tournament he was just max at 86 again - not good enough. Thanks for your interest.
He eventually committed to a D1 program here in the NE. His PG max is listed at 87.
BTW, this included a total of nearly 50,000 pitchers we saw.
These numbers pretty much match up with what my son saw (2015 RHP at a mid-major D1). Summer after junior year.....really good schedule. He normally threw after a kid being recruited by most of the schools East of the Mississippi....so quite a few coaches had a chance to see him. As soon as he hit 87 while sitting 84-86 he got an offer. He loved the school...and the coaches...took the offer and we were done. We had been told that 87/88 was the "magic" number...and as it turns out...that info was spot on. This spring (HS senior)....first game hit 91. Mid-season hit 89 on hit 100th pitch of a game. Sat 86-88 all summer...and really didn't look to me like he was trying very hard. Kind of wonder what may have been if he had waited...but he's happy where he is...that's all that matters. Hasn't had a gun on him since July. His pro-day is Monday so I guess we'll see where he is now.
Originally Posted by PGStaff:
OK, I now have the numbers I promised earlier.
A couple things to keep in mind...
The velocity we have recorded doesn't mean that is actually the highest velocity any of those pitchers has thrown. Also we tend to see a much higher percentage of all those that throw higher velocities than we do all those that throw lower velocity. And also we see a larger number of pitchers than most anybody, we still only see a small percentage of all the HS pitchers out there. Also, remember that our database grows almost daily.
According to our database as of this morning. HS age pitchers only.
Peak Velocity 90 mph or better
Total - 876
2015 class - 489
2016 class - 324
2017 class - 47
2018 class - 16
Peak Velocity 88 mph or better
Total All Classes - 2116
Peak Velocity 85 mph or better
Total All Classes - 6,429
Peak Velocity 80 mph or better
Total All Classes - 26,617
I will let our math minds take over from here. But keep in mind these numbers are only a fraction of the total amount of HS age pitchers. Also, this does not include all those under 80mph.
Math Girl raises her hand!
Just to clarify, because this seems VERY odd.
1. The amount of High School Players throwing 90 mph or better is 876.
2. The amount of High School Players throwing 88 mph or better is 2116.
Therefore, the amount of High School Players throwing 88 and 89 mph is 1240?
That math seems off.
Originally Posted by PGStaff:
OK, I now have the numbers I promised earlier.
A couple things to keep in mind...
The velocity we have recorded doesn't mean that is actually the highest velocity any of those pitchers has thrown. Also we tend to see a much higher percentage of all those that throw higher velocities than we do all those that throw lower velocity. And also we see a larger number of pitchers than most anybody, we still only see a small percentage of all the HS pitchers out there. Also, remember that our database grows almost daily.
According to our database as of this morning. HS age pitchers only.
Peak Velocity 90 mph or better
Total - 876
2015 class - 489
2016 class - 324
2017 class - 47
2018 class - 16
Peak Velocity 88 mph or better
Total All Classes - 2116
Peak Velocity 85 mph or better
Total All Classes - 6,429
Peak Velocity 80 mph or better
Total All Classes - 26,617
I will let our math minds take over from here. But keep in mind these numbers are only a fraction of the total amount of HS age pitchers. Also, this does not include all those under 80mph.
This is fantastic stuff! Thank you.
Roughly speaking, perhaps 1,500 kids per graduating class will be able to touch 88 by the time they graduate high school (here's my calculation: the total at 88 mph was about 2.5x the total at 90 mph. Since the class of 2015 had 489 kids who had touched 90 mph, it would have had about 1200 at at 88 mph or higher. Now factor in that PG doesn't see all of the kids who touch 88 mph, so I rounded up to 1,500).
That's a little higher than I would have guessed, but not drastically.
My takeaways are (1) 90 is a round number -- well, rounder than 88 -- but these numbers show that even nowadays, with more kids throwing 90 than ever, there are just not enough 90 mph pitchers (even using an expansive definition of having touched 90 mph) to meet the recruiting needs of D1 schools; (2) touching 88 is a fairly "safe" number -- I would think that, assuming their grades are sufficient, all of those kids would be recruited to college baseball, with the vast majority recruited to D1 (also, assuming that they can pitch a little).
Of course, my second calculation -- and I can't be the only dad who can't help himself -- was along the lines of:
(88 − (2019Son's current max velocity) = y mph to go) ÷ number of years to graduation = mph needed per year
. . . or something like that ![]()
Originally Posted by CaCO3Girl:
Originally Posted by PGStaff:
OK, I now have the numbers I promised earlier.
A couple things to keep in mind...
The velocity we have recorded doesn't mean that is actually the highest velocity any of those pitchers has thrown. Also we tend to see a much higher percentage of all those that throw higher velocities than we do all those that throw lower velocity. And also we see a larger number of pitchers than most anybody, we still only see a small percentage of all the HS pitchers out there. Also, remember that our database grows almost daily.
According to our database as of this morning. HS age pitchers only.
Peak Velocity 90 mph or better
Total - 876
2015 class - 489
2016 class - 324
2017 class - 47
2018 class - 16
Peak Velocity 88 mph or better
Total All Classes - 2116
Peak Velocity 85 mph or better
Total All Classes - 6,429
Peak Velocity 80 mph or better
Total All Classes - 26,617
I will let our math minds take over from here. But keep in mind these numbers are only a fraction of the total amount of HS age pitchers. Also, this does not include all those under 80mph.
Math Girl raises her hand!
Just to clarify, because this seems VERY odd.
1. The amount of High School Players throwing 90 mph or better is 876.
2. The amount of High School Players throwing 88 mph or better is 2116.
Therefore, the amount of High School Players throwing 88 and 89 mph is 1240?
That math seems off.
Why does it seem off? It seems reasonable to me that as you move down the scale the numbers would skyrocket . . .
Originally Posted by 2019Dad:
Originally Posted by CaCO3Girl:
Why does it seem off? It seems reasonable to me that as you move down the scale the numbers would skyrocket . . .
Agreed....the jump from 88 to 90 is BIG! Wait until your son is throwing 84 and you think "Great, he'll be 86 in a couple weeks"....nope, doesn't happen that way. Those numbers don't seem that far out of line.
Originally Posted by 2019Dad:
Math Girl raises her hand!
Just to clarify, because this seems VERY odd.
1. The amount of High School Players throwing 90 mph or better is 876.
2. The amount of High School Players throwing 88 mph or better is 2116.
Therefore, the amount of High School Players throwing 88 and 89 mph is 1240?
That math seems off.
Why does it seem off? It seems reasonable to me that as you move down the scale the numbers would skyrocket . . .
Move down the scale in big chunks like 85+ sure. Move down only 2 mph and the difference is there are two and half as many kids throwing 88 and 89 than 90, that seems statistically unlikely. Then again, it's baseball!
2020dad
Agreed 2019. As you go further down from 90 you will see larger and larger groupings. Looks right to me.
I would like to add that when it comes to securing a D-1 Offer, top speed isn't the only thing they are looking for in the Velo Dept. Sometimes, depending on where the team is in the recruiting calendar, the coach may eliminate you from contention based on maintaining the velocity.
An example that I have is of my son. It was late in the recruiting time table, and he was being recruited by 2 Big XII schools. He ended up not going to either, one a small offer, the other no offer. When the no offer school flew out to see him pitch, son threw 87 - 89 in the first 2 innings, but dropped to 83 - 85 for the remaining 5 innings. If it had been earlier in the process, I am sure he would have received an offer. As it was, they were looking at one other kid and my son.
Those are the numbers, they are actual.
Guess I didn't look close enough to notice anything unusual.
But now that someone seems to be challenging the numbers, I suppose I could get our IT dept to nail things down. However after looking at the numbers closer and knowing what I asked for, it actually makes a lot of sense.
The vast majority of pitchers we see at 90 or better are 90-91, next would be 92 and anything over that would be a very small percentage.
We see a very large number of pitchers 87-89. More each mph you move down. So I am not surprised that we see two 88mph pitchers for every one 90 mph pitcher. Just as we see 4 or 5 times the number of 85s.
Don't recheck anything on my account. Statistically speaking those numbers look weird, then again this is the sport where getting on base 40% of the time makes people jump up and down with glee.
BTW, I didn't have our IT dept do this and post it here, in order to be questioned about the numbers. Those are the REAL numbers according to our database. If it seems ODD, so be it. Before I got the numbers, I actually thought they would be higher.
This was a discussion about velocity. There is no reason for me to post up inaccurate information. Just look at the numbers and decide for yourself if they mean anything. Maybe they don't mean a damn thing. Maybe someone thinks they do. Probably no reason to post them, because I sure didn't want to defend them. I'm not sure what they mean.

Originally Posted by PGStaff:
BTW, I didn't have our IT dept do this and post it here, in order to be questioned about the numbers. Those are the REAL numbers according to our database. If it seems ODD, so be it. Before I got the numbers, I actually thought they would be higher.
This was a discussion about velocity. There is no reason for me to post up inaccurate information. Just look at the numbers and decide for yourself if they mean anything. Maybe they don't mean a damn thing. Maybe someone thinks they do. Probably no reason to post them, because I sure didn't want to defend them. I'm not sure what they mean.
Thanks for taking the time to post them. It is appreciated!
PG your data is very interesting and with a few more data points you can do a lot of predictions with it. If you can collect it by year it will allow you to be able to do some predictions where a player might end up if the data is collected after they get to college or the pros. Seriously if you want to make some more $$$ (and who does not) you should get in touch with Josh H (or some other MLB scouting department, or for that matter it a college, this would make a very interesting thesis) I have to say this is the MOST interesting data I have seen since I have been to this site.
So what I did was plot it in excel and then curve fit it. I then looked at a couple of options to curve fit it and found that a logarithmic curve fit it the best. With this data you will be able to tell any player where he fits in your scouting population. Seriously good stuff.
BTW: Buckey this is exactly why your son need to take calculus!!!

Late Add: I will go back and see if I can make the picture more readable.
Originally Posted by PGStaff:
BTW, I didn't have our IT dept do this and post it here, in order to be questioned about the numbers. Those are the REAL numbers according to our database. If it seems ODD, so be it. Before I got the numbers, I actually thought they would be higher.
This was a discussion about velocity. There is no reason for me to post up inaccurate information. Just look at the numbers and decide for yourself if they mean anything. Maybe they don't mean a damn thing. Maybe someone thinks they do. Probably no reason to post them, because I sure didn't want to defend them. I'm not sure what they mean.
PGStaff, thanks for sharing the numbers. It's always interesting to get insights into the PG data warehouse. Now your fall project would be to correlate those 90+ guys in HS to TJ surgery.
Originally Posted by BOF:
PG your data is very interesting and with a few more data points you can do a lot of predictions with it. If you can collect it by year it will allow you to be able to do some predictions where a player might end up if the data is collected after they get to college or the pros. Seriously if you want to make some more $$$ (and who does not) you should get in touch with Josh H (or some other MLB scouting department, or for that matter it a college, this would make a very interesting thesis) I have to say this is the MOST interesting data I have seen since I have been to this site.
So what I did was plot it in excel and then curve fit it. I then looked at a couple of options to curve fit it and found that a logarithmic curve fit it the best. With this data you will be able to tell any player where he fits in your scouting population. Seriously good stuff.
BTW: Buckeye 2015- this is exactly why your son need to take calculus!!!
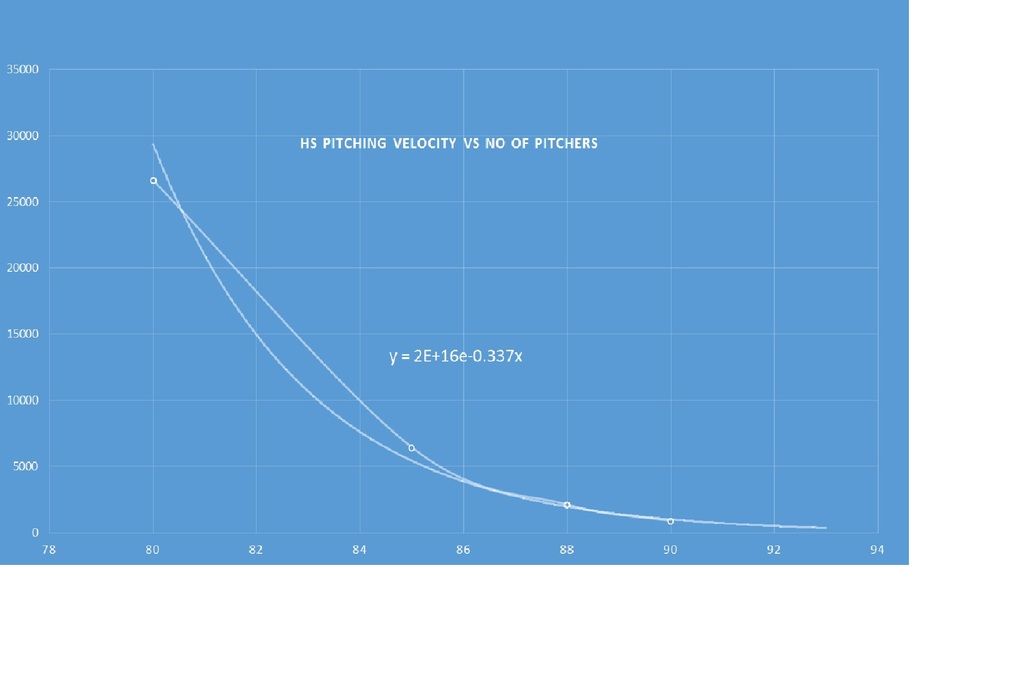
Late Add: I made the picture bigger and put in the equation. Now anyone can calculate where their son fits based on velo. GREAT STUFF! PG I sent you the excel file via your business email.
2020dad
Originally Posted by rynoattack:
Originally Posted by PGStaff:
BTW, I didn't have our IT dept do this and post it here, in order to be questioned about the numbers. Those are the REAL numbers according to our database. If it seems ODD, so be it. Before I got the numbers, I actually thought they would be higher.
This was a discussion about velocity. There is no reason for me to post up inaccurate information. Just look at the numbers and decide for yourself if they mean anything. Maybe they don't mean a damn thing. Maybe someone thinks they do. Probably no reason to post them, because I sure didn't want to defend them. I'm not sure what they mean.
Thanks for taking the time to post them. It is appreciated!
Strongly agreed. Please in the future provide us with such information. Love it.
Although I know since it's not all the HS pitchers so it's an asumptive leap but going by the chart and PG's numbers and the estimation of 100,000 HS pitchers. Touching 80 would put you in the top 30% of HS pitchers. Touching 85 in the top 10% and touching 90 in the top 1 to 2%. That seems about right to me and why I cring every time I hear someone say "where I'm from the average HS pitcher is about 88. Heck you won't even sniff varsity at 85" lol.
Scotty83,
One thing to keep in mind is the number of HS pitchers that throw 85 or better and even 90 or better is much different in some areas than others.
There are high schools in certain parts of the country where most all the pitchers are above 85. In other parts of the country there are many high schools where it is unusual to see 80 mph.
Looking at the chart "BOF" put together, it pretty much proves everyone right. Yes there are a lot of HS pitchers who can throw 90 or better. Yes, based on percentage they are rare.
Maybe I could ask our IT guys to give me the numbers for every velocity and separate it by RHP and LHP. That might make for an interesting chart. I assume our numbers would be a bit higher than if you had the numbers for every HS pitcher. For example, I think we see the majority of pitchers that throw the top velocities and the majority of those with the lowest velocity we don't see.
So based on that, and this does surprise me, our average HS velocity is nearly 81 mph. So I'm just guessing the true HS average velocity would be something like 78-79 mph. 84-86 mph is very good when you look at it that way. And some of those mid 80s HS pitchers will end up throwing 90 or better in the future. We got Trevor Rosenthal throwing mid 80s in HS.
Originally Posted by PGStaff:
Scotty83,
One thing to keep in mind is the number of HS pitchers that throw 85 or better and even 90 or better is much different in some areas than others.
There are high schools in certain parts of the country where most all the pitchers are above 85. In other parts of the country there are many high schools where it is unusual to see 80 mph.
Looking at the chart "BOF" put together, it pretty much proves everyone right. Yes there are a lot of HS pitchers who can throw 90 or better. Yes, based on percentage they are rare.
Maybe I could ask our IT guys to give me the numbers for every velocity and separate it by RHP and LHP. That might make for an interesting chart. I assume our numbers would be a bit higher than if you had the numbers for every HS pitcher. For example, I think we see the majority of pitchers that throw the top velocities and the majority of those with the lowest velocity we don't see.
So based on that, and this does surprise me, our average HS velocity is nearly 81 mph. So I'm just guessing the true HS average velocity would be something like 78-79 mph. 84-86 mph is very good when you look at it that way. And some of those mid 80s HS pitchers will end up throwing 90 or better in the future. We got Trevor Rosenthal throwing mid 80s in HS.
Your IT guys must love HSWEBB :-)
The above figures are pretty neat though and i think you probably hit it when you state some of the 84-86 guys in high school probably have a couple more mph in them...so probably the top D1's look for the 88 and above while the other D1's, D2, etc are open to looking at a wider spectrum of velo
Add Reply
Sign In To Reply