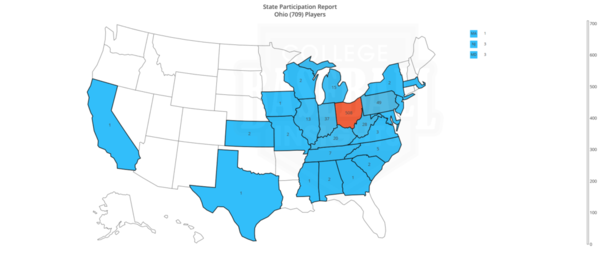
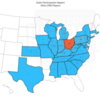
In 2019, there were an estimate of  709 freshman student-athletes from the state of Ohio on college baseball rosters.  


508 played in OH

Top out of state

PA  - 49

IN   - 37

OH 2019 Freshman State Participation by State

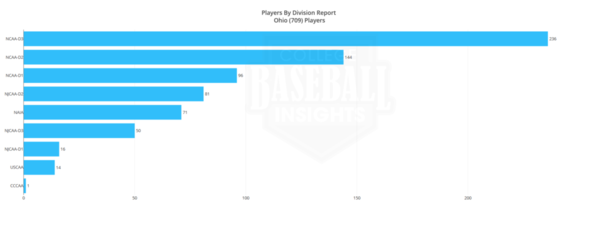
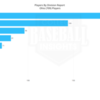
Division

NCAA-D3 - 236

NCAA-D2 - 144

NCAA-D1 - 96

OH 2019 Freshman State Participation by Division

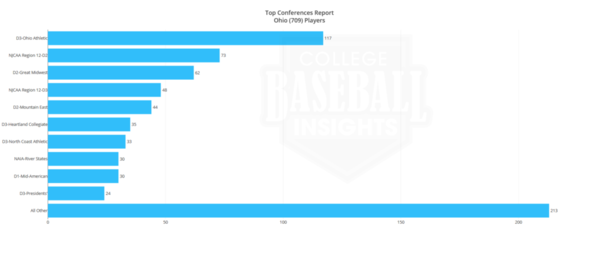
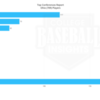
Top Conferences

Ohio Athlete (NCAA-D3)  - (117)

Region 12   (NCJAA-D2) - (72)

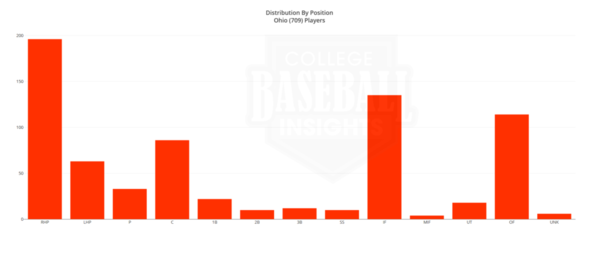
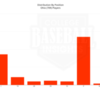
OH 2019 Freshman State Participation by ConferenceOH 2019 Freshman State Participation by Position

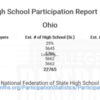
In 2018,   ~22,500 OH  students played High School Baseball.   Upon using a factor of 25% are seniors (~5650)

OH National Federation High School

Disclaimer: Insights are generated based on information extracted before April 15.

Attachments

Images (5)
  • OH 2019 Freshman State Participation by State
  • OH 2019 Freshman State Participation by Division
  • OH 2019 Freshman State Participation by Conference
  • OH 2019 Freshman State Participation by Position
  • OH National Federation High School
Last edited by CollegebaseballInsights
Original Post

Replies sorted oldest to newest

So, CBI, all these stats are interesting, but they are kind of cluttering up the board.  Which of these numbers do you thing are most interesting or significant?  # of college players: estimated number of hs seniors?  % instate vs. % out of state?  % D3 vs. % juco?  Do you see meaningful trends between regions or something like that? 

In other words, what do you think we should be taking from all of this?  That would help us to look at all the stats.

anotherparent posted:

So, CBI, all these stats are interesting, but they are kind of cluttering up the board.  Which of these numbers do you thing are most interesting or significant?  # of college players: estimated number of hs seniors?  % instate vs. % out of state?  % D3 vs. % juco?  Do you see meaningful trends between regions or something like that? 

In other words, what do you think we should be taking from all of this?  That would help us to look at all the stats.

Anotherparent,  this is a top level view. 

When you are saying these topics are cluttering up the board, please explain.  

Are you being forced to review the topic?

What state are you from?  How far are you into the research process?

What are your target schools? Has that schools recruited from your state in the past 3 years? 

When I was doing the travel circuit with my son in 2009 - 2014, we traveled all along the East Coast for Tournaments and Showcase.  My spend was between 5k to 7.5k annually for training and playing.  We went to the week long PG tournament in Georgia, fortunately I had a relative living there, thus my lodging cost was only food.

Fortunately, my son was a two way player, so he got the maximum # of at bats and usually pitched 5 to 6 innings.

Question, how many players from Ohio are playing in Florida or have played in Florida for the last 3 years.  In my humble, understanding the state demographics provide some insights as to where a player from the state might find a roster spot. 

Note, this is a top level view of which student-athletes and parents can hopefully establish a realistic area to target schools.

Subsequently using some of these articles listed below, reading these threads and other resources, a student-athlete and parent can hopefully narrow their target schools quicker.

Investigating College Baseball Programs


https://keepplayingbaseball.or...e-programs-online-2/

https://keepplayingbaseball.or...-school-recruitment/

https://keepplayingbaseball.or...rents-answered-2018/

https://keepplayingbaseball.or...-scholarship-offers/


What you Need to know about community College Baseball by Ethan Guevin


https://keepplayingbaseball.or...ege-baseball-part-1/

https://keepplayingbaseball.or...ll-part-2-academics/

https://keepplayingbaseball.or...part-3-transferring/

https://keepplayingbaseball.or...rt-4-levels-of-play/


Regards

I love data!  I saw some interesting things - % of seniors/college players was quite different from state to state, for example, so was % in jucos.  I was interested to know what you think we should all be taking from this data, so thanks for your answer.

I love the keepplayingbaseball blogs, those are really useful references.

What I meant by cluttering is that all these posts are bumping others out of the topics bar.  But it's all good.

Thanks for posting these, CBI.

I'm intrigued by the "country map" charts in particular and think it's one of the most telling visuals and helpful tools I've seen yet for someone in the recruiting process.  It may not have helped us so much since California seems to be the only state (so far) where there are significant numbers heading out beyond the "neighboring states" radius.  But, boy, if I lived in any of the other states posted so far, I would be paying serious attention to this.

Of course, I suspect FL, GA, TX may be a bit different, and maybe the Carolina's and Virginia.  Keep 'em coming.  Maybe to Anotherparent's point, you can lump some states in one post?  I really don't know all the pro's and con's one way or the other as far as searchability, band width, etc.  You probably have good reason for doing it the way you are.

anotherparent posted:

I love data!  I saw some interesting things - % of seniors/college players was quite different from state to state, for example, so was % in jucos.  I was interested to know what you think we should all be taking from this data, so thanks for your answer.

I love the keepplayingbaseball blogs, those are really useful references.

What I meant by cluttering is that all these posts are bumping others out of the topics bar.  But it's all good.

Now I understand.  Maybe it would be best to publish a region per week (on a Saturday or Sunday).

 Let me know if that makes some sense.

With respects to what what individual should be taking from the data.

In my humble opinion,  this information can initially be used to level set expectations of travel team,student-athlete and parent.  Note, review a 3 to 4 year pattern of Player distribution.

Note, the free version allows you to get some high level numbers, but we can also answer the same question at the position level.

E.g

How many pitchers (RHP, P, LHP) from state XX are playing NCAA-D1?  Thus now a user can pinpoint demographics at a skill position level.

Note, there are many possible questions that one can ask, we are thinking about new things every day.  Upon receiving feedback from stakeholders the objective is to insure you are comfortable with your college selection.  You've answered all the questions or have a good idea as to what to look for when on the recruiting journey. 

As Denzel Washington said in the play "Fences"  Sometimes you have to take a straight line crooked.  Hopefully it is not too crooked.


Regards.

cabbagedad posted:

Thanks for posting these, CBI.

I'm intrigued by the "country map" charts in particular and think it's one of the most telling visuals and helpful tools I've seen yet for someone in the recruiting process.  It may not have helped us so much since California seems to be the only state (so far) where there are significant numbers heading out beyond the "neighboring states" radius.  But, boy, if I lived in any of the other states posted so far, I would be paying serious attention to this.

Of course, I suspect FL, GA, TX may be a bit different, and maybe the Carolina's and Virginia.  Keep 'em coming.  Maybe to Anotherparent's point, you can lump some states in one post?  I really don't know all the pro's and con's one way or the other as far as searchability, band width, etc.  You probably have good reason for doing it the way you are.

cabbagedad,

I was trying to logically provide some context based on the state perspective

Distribution by State

Distribution by Division

Distribution by Conference (Top 10)

Distribution by Position

National Federation of High Schools (4 yrs of participation)

If I were to consolidate into one post it might get lost in translation.

For example:

As a parent, I would initially just care about my state (NJ), but then if you don't think about some neighboring state, e.g PA, NY, MD, DE. you might be in a world of hurt.

Note, if I would have known some of the stuff that I knew now, I would have sent my son to the PSAC (NCAA-D2) probably Westchester, we were doing our physical training close by.  The school provided interns to the physical therapist that we had used since 8th grade. The same physical therapist the was provide proactive training so my son would be ready for the season.

I'm going to stagger the post, I will just need to determine the timeliness of publish said data to help the students-athletes and parents see the big picture.

Work in progress.

Thanks for the feedback. 

Buckeye 2015 posted:

I assume the position chart is their position in college?  I'd be curious to see the HS position.  There are very few SS's, which would make sense, since not many college teams have a freshman SS.  It would interesting to see the "main" position of those same 709 kids on their HS team. 

It is their primary position.   Many colleges use generic terms:


IF for all infield positions

OF for all Outfield Positions


Add Reply

Post
Goodwill Series
×
×
×
×
Link copied to your clipboard.
×